Math 132A
Probability Distributions
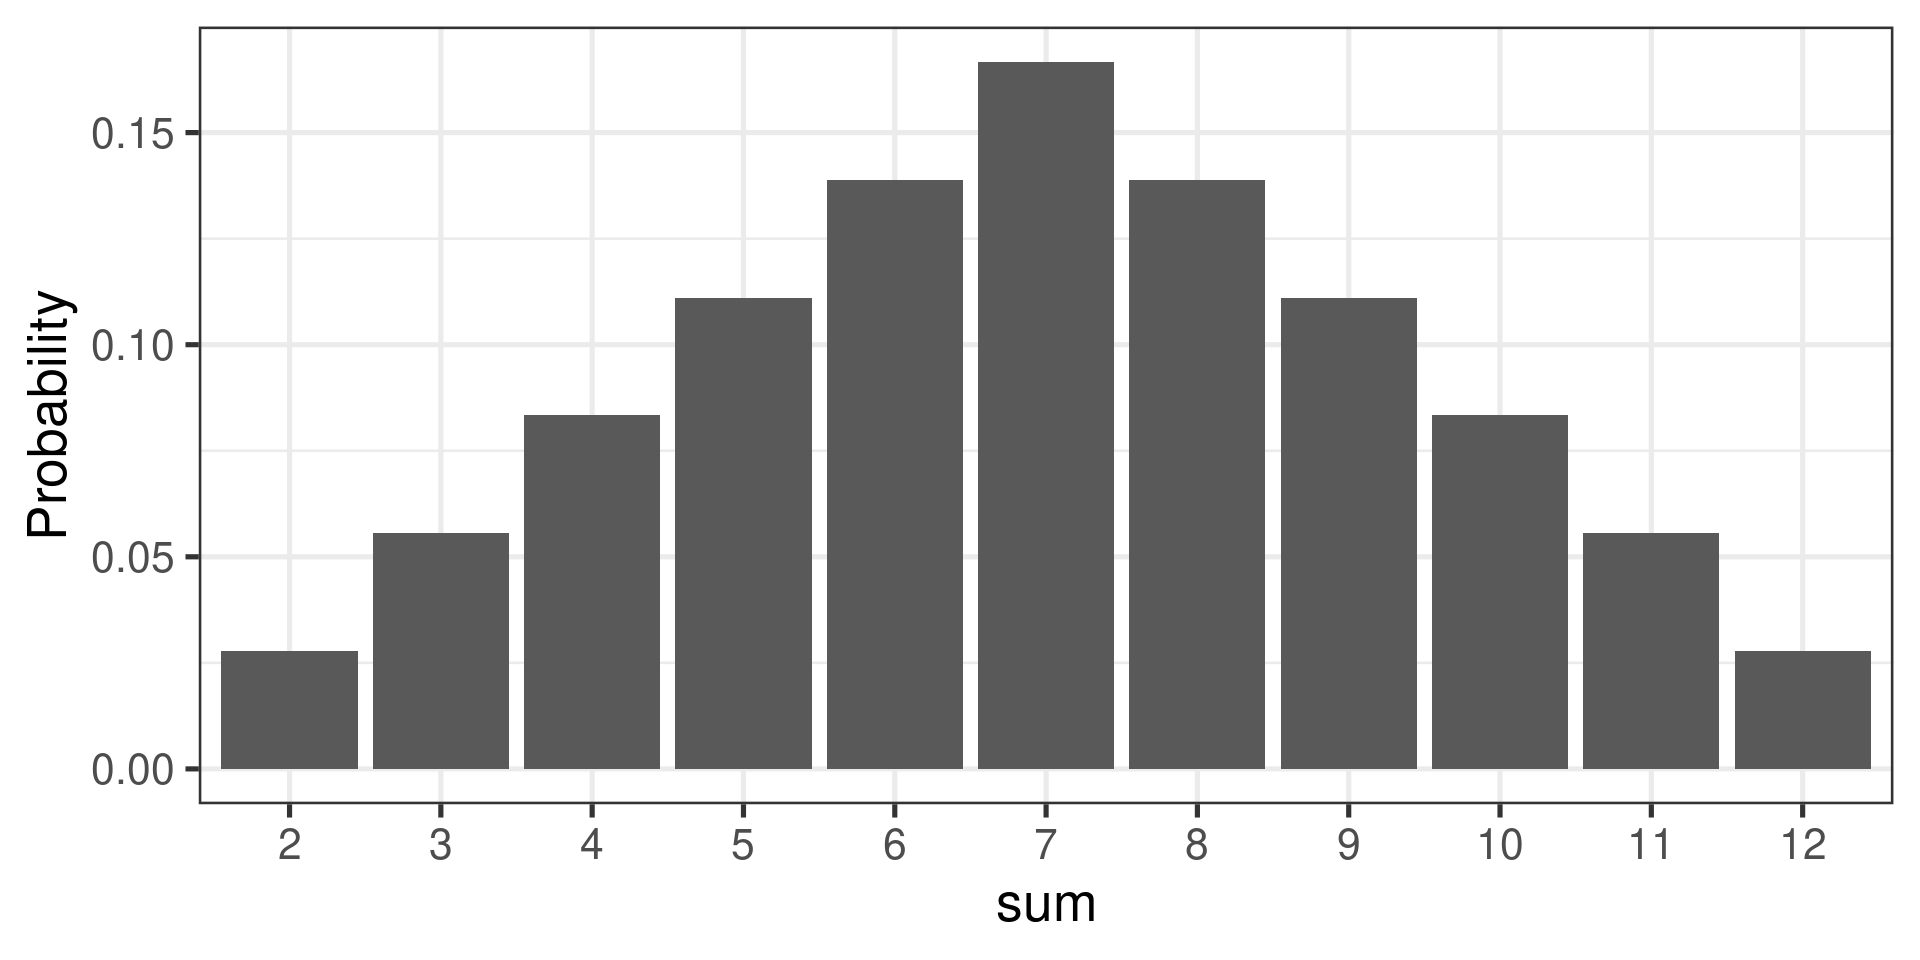
Two dice example
Suppose we roll two dice and add the two numbers that show on the top of the dice.
Alternative Sample Space
Not equally likely outcomes!
Graphical Representation
| \(1/32\) |
\(2/36\) |
\(3/36\) |
\(4/36\) |
\(5/36\) |
\(6/36\) |
\(5/36\) |
\(4/36\) |
\(3/36\) |
\(2/36\) |
\(1/36\) |
A Loaded Die
| Probability |
.1 |
.15 |
.15 |
.15 |
.15 |
|
Colors of Snails
Certain species of snails can have 5 different color variations: yellow, brown, green, black, and blue. At certain location, 30% of the snails are yellow, 20% are brown, 5% are green, and 22% are black. We randomly select one of the snails and record its color.